


Each year 1.3 billion tons of food is wasted globally, which is about a third of all that is produced. This is particularly alarming given estimates that we’ll likely have 2 billion more mouths to feed by mid-century. That is more than 9 billion people worldwide.
During our research and upon studying the data available on food waste, we deciphered some upsetting facts in regard to the relationship between the wasted food and the produced food. Through this data visualisation, we aimed to provoke the viewer and bring an awareness around the impact the wasted food has monetarily across the globe.
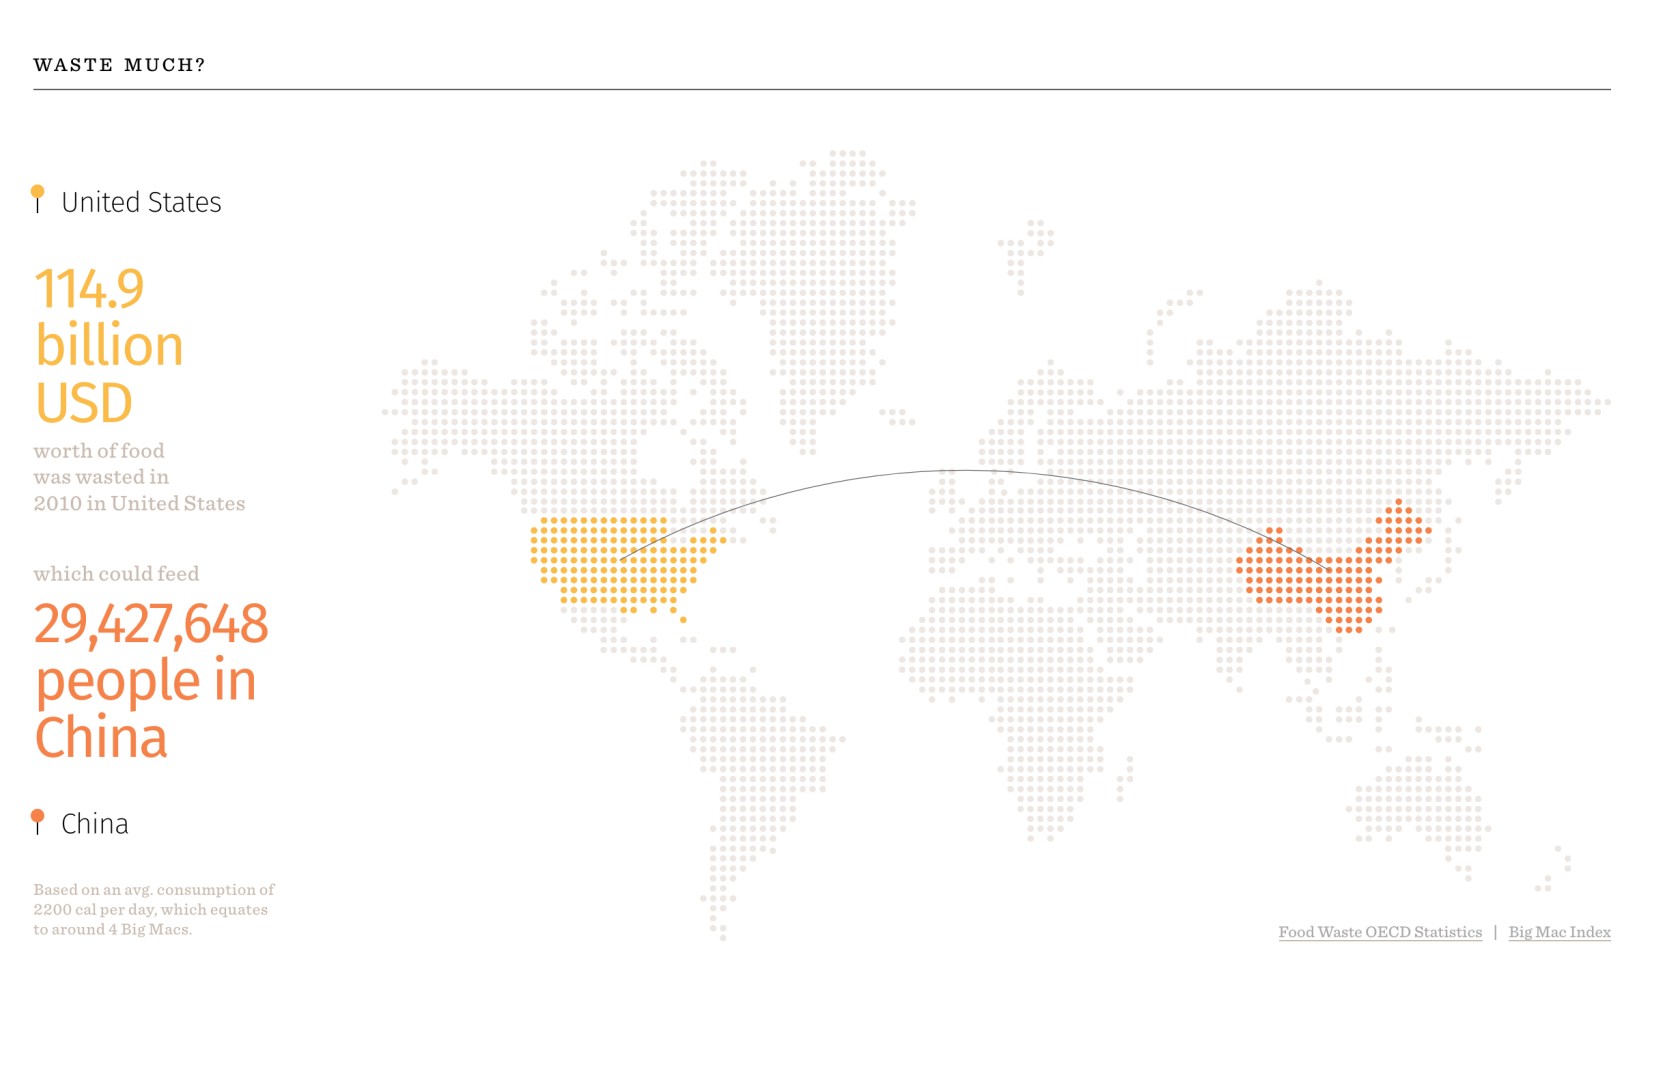
The data visualisation reflects the relationship between the amount of money lost due to food waste in a country versus how many people that money could feed in another country.
We achieved this through a correlation between the annual food waste in households over the last 10 years available on OCED and the purchasing power parity between two countries using the Big Mac Index.
We wanted to tell a compelling story through the data we had available, such that it was easy to understand. After preliminary research, we ideated on questions we wanted to answer through this project. Further on we conceptualised the visualisation on paper and then translated that into an interactive digital version by creating a web application using the D3 JavaScript library.
Contribution
Apart from conception and designing the interactions I was responsible for the build of the digital prototype.
Links: Live Test